
Qwaiting has recently introduced queue overview per time and queue overview per day reports to boost its capabilities. These reports will help companies manage their daily clients more effectively. The two new reports are “Queue Overview Per Time”and “Queue Overview Per Day”.
Queue Overview Per Time
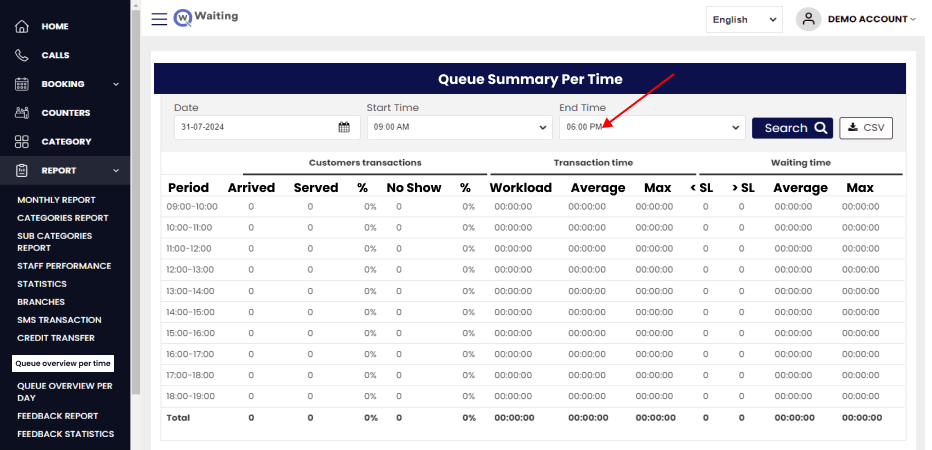
Qwaiting Queue Overview Per Time provides a complete overview of the queue performance, data on the customer’s wait time, and detailed information according to the time slots on an hourly basis.
Customer Transactions:
- Arrived: Number of customers who arrived during each time slot.
- Served: Number of customers who were served during each time slot.
- % (Served Percentage): Percentage of arrived customers who were served.
- No Show: Number of customers who did not show up during each time slot.
- % (No Show Percentage): Percentage of arrived customers who did not show up.
Transaction Time:
- Workload: Total time spent on transactions during each time slot.
- Average: Average transaction time per customer.
- Max: Maximum transaction time recorded.
Waiting Time:
- < SL: Number of customers whose waiting time was less than the service level (SL).
- > SL: Number of customers whose waiting time was greater than the service level (SL).
- Average: Average waiting time for customers during each time slot.
- Max: Maximum waiting time for customers during each time slot.
- Total (Average): Overall average waiting time across all time slots.
- Total (Max): Overall maximum waiting time across all time slots.
To check the queue-per-time report,
- Go to the report section.
- Click on the Queue Overview Per Time
- Then there is a queue-per-time report where you get to know the time served by the customer.
Queue Overview Per Day
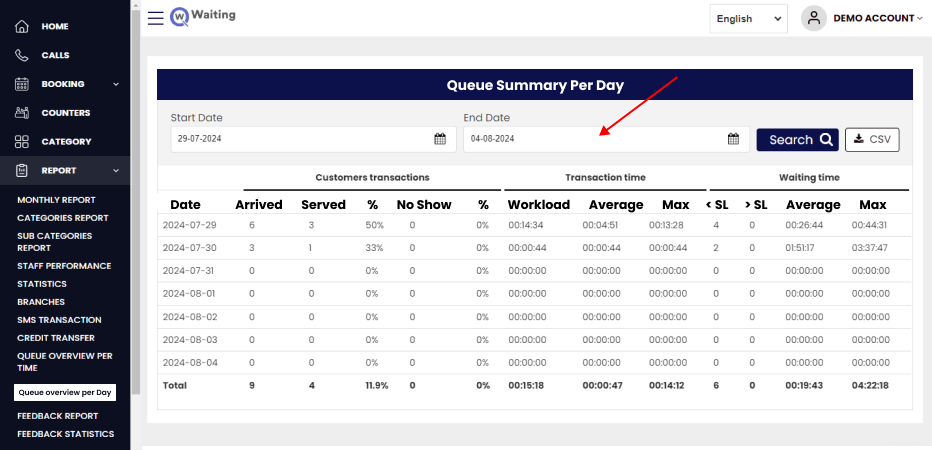
Qwaiting Queue Overview Per Day provides a complete overview of the queue performance and details according to the 24-hour day slot daily.
Customer Transactions:
- Date: The specific date of the report.
- Arrived: Number of customers who arrived on that date.
- Served: Number of customers who were served on that date.
- % Served: Percentage of arriving customers who were served. Calculated as (Served / Arrived) * 100.
- No Show: Number of customers who did not show up after arriving.
- % No Show: Percentage of customers who did not show up. Calculated as (No Show / Arrived) * 100.
Transaction Time:
- Workload: Total transaction time spent serving customers.
- Average Transaction Time: Average time spent on each transaction.
- Max Transaction Time: Maximum time spent on a single transaction.
Waiting Time:
- < SL: Number of transactions completed within the Service Level (SL) time.
- > SL: Number of transactions that exceeded the Service Level (SL) time.
- Average Waiting Time: Average waiting time for customers before being served.
- Max Waiting Time: Maximum waiting time for a single customer.
To check the Queue Per Day report,
- Go to the report section.
- Click on the Queue Overview Per Day category
- Then there is a queue per day report where you get to know the daily time served by the customer.
Benefits of These New Reports
#1. Detailed Performance Analysis
It gives you a precise understanding of queue patterns through hour-by-day reports. It helps companies improve their staff distribution, reduce wait times, and boost customer satisfaction. This data-driven method provides effective processes for better service.
#2. Improved Customer Service
Improved customer service comes from understanding queue trends. This lets you assign staff better. It also reduces wait times. This creates a smoother experience for customers. As a result, customers are happy and satisfied.
#3. Transaction Insights
The data from queue reports can help businesses. It shows their busy times. This lets them adjust their services. They can use their resources better. This improves how they operate. This leads to happier customers and more sales.
#4. Real-Time Data
Instant information from queue reports shows your customer traffic. It lets you quickly change staff levels and resources. This fast response reduces delays. It also improves service and customer satisfaction. It also boosts operational performance.
#5. Complete Analysis
Analysing reports from the queue provides valuable insights into customer traffic patterns. It helps companies to identify their trend, improve staff allotment, and upgrade service tactics. It leads to improved methods, customer happiness, and superior results.
#6. Better Resource Allocation
Queue data spreads resources and provides staffing and resources aligned with customer needs. Optimisation reduces rest time, prevents overcrowding, and improves service efficiency for better customer experience and smoother operation.
#7. Customer Experience Improvement
You can use queue reports to increase customer experience. This shows peak hours and problems with service. Companies can then reduce wait times. They can also simplify service procedures. This improves the customer experience, which leads to more satisfied and loyal customers.
#8. Data-Driven Decisions
Queue reports assign data-driven decision-making by showing in-depth research on customer traffic trends. This data helps companies make informed changes to staffing, resource distribution, and service plans. They boost operating efficiency, improving customer satisfaction and improving performance.