

Poor customer service costs U.S. businesses approximately $62 billion annually, according to Truelist. When customers wait too long, they simply walk out before being served or skip appointments if they feel confused about their wait times. You’re not just losing your business reputation, but also revenue opportunity and operational capacity.
But here’s what most business owners don’t realize: up to 63% of queue abandonment happens not because the wait is too long, but because customers have no clue of their wait times and when they’ll be served. The good news? Modern queue management technology like Qwaiting has transformed how businesses handle customer flow, turning chaotic waiting rooms into streamlined operations that maximize revenue while slashing customer complaints by half.
In this comprehensive guide, we’ll cover: the effect of long wait lines on customer satisfaction and business revenue, what causes the money leak, and how to fix it before your competitor does.
Why long queues are more than a customer experience issue
Most operators know long waits are bad. Few can quantify exactly how bad. Let’s break it down into the five places where queue management costs show up in your Profit and Loss:
Walkouts
A customer enters your branch, sees the line, checks their watch, and leaves. That’s not a “maybe later”, it’s a lost transaction.
Research shows businesses lose 75% of customers who experience excessive wait times, and most never return. Even worse, each dissatisfied customer shares their negative experience, ultimately tarnishing your brand image.
No-shows
Appointments without reminders have a 15–28% no-show rate. Patients, clients, and applicants forget, get busy, or assume you’ll call to confirm. Every no-show costs you the slot revenue plus the sunk labor cost of the staff member who sat idle.
Throughput drag
When queues aren’t managed, routine operations slow down. Staff waste time manually directing customers, answering repeated questions, and calming frustrated people. Hundreds of lost transactions every week directly impact your bottom line.
Overtime and overstaffing
Without real time business analytics, you’re flying blind on staffing. You end up with too many employees standing around during quiet hours, or too few during rushes when customers are walking out the door. Most businesses overstaff just to be safe, which drains payroll unnecessarily. But when demand suddenly spikes, you’re still caught short-handed, creating the exact bottlenecks that drive customers away. Guessing your staffing needs means you lose either way.
Churn
Customers who wait too long don’t just complain, they leave. When customers experience excessive lobby times, they’re far more likely to take their business elsewhere compared to those served quickly. Each lost customer doesn’t just represent one missed transaction; it’s years of future revenue walking out the door.
Bottom line: $37.7 billion revenue loss isn’t just an “experience” problem. It’s a margin problem. And it’s measurable.
Why most businesses can’t see where the wait is hurting them
Here’s the frustrating part: the data already exists in your operation. It’s just trapped.
“Your POS or EMR knows transaction counts, but not how many walked away before transacting?”
You see completions. You don’t see the people who checked the line and left. Without door counters, mobile check-in logs, or service dashboards that track “arrived but not served,” you’re measuring the survivors, not the total demand.
“Hard to track missed appointments using the manual scheduling method.”
If you’re still relying on paper logs and register entries, you can’t easily calculate customer no-shows by specific day of week, time slot, or service type. Without these insights, you’ll continue to schedule high-risk appointments at problematic times, repeating the same costly mistakes week after week.
“Staffing decisions rely on ‘we’re always busy Tuesdays’ instead of demand curves.”
Most managers schedule based on what they think they remember: “Mondays are crazy” or “We’re slow after lunch.” But memory is selective and misses the real patterns. Queue analytics reveal the actual demand curves, when your peaks truly occur, or how long they last. Aligning your staffing to match these precise patterns can significantly increase throughput without requiring additional staff.
“Nobody owns the queue”
In many operations, the front desk is responsible for managing the line, but there is no systematic review of wait time trends. Without monthly reports on customer behavior and a system for using queue data to adjust schedules, the queue’s issues are hidden and only become apparent when customers complain.
How smart queue management improves operational performance and maximizes profit
Let me guide you through effective queue management in practice by showcasing real implementations that have proven successful.
Real-time visibility
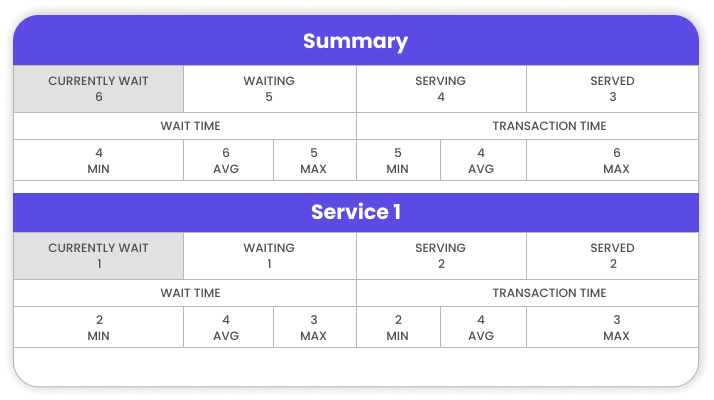
A comprehensive service dashboard provides live updates of your entire operation. From tracking current wait times, customer volume by service category, and average transaction duration, when critical thresholds are exceeded.
Key capabilities include:
- Live queue monitoring: Track customer count, wait times, and service distribution across all channels in real-time
- Predictive threshold alerts: Receive automated notifications when queues approach critical levels, enabling proactive intervention before walkouts occur
- Dynamic resource allocation: Instantly identify which staff members can be redeployed to address bottlenecks based on current demand patterns
Automated Appointment Reminders & Confirmations
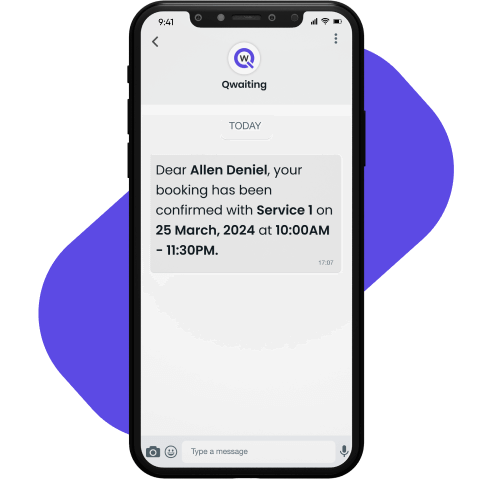
Multi-channel reminders delivered via SMS and email at strategic intervals before scheduled appointments significantly reduce no-show rates while minimizing last-minute cancellations that leave staff idle.
Key capabilities include:
- Multi-touchpoint communication: Automated reminders sent at optimal intervals (48 hours and 24 hours prior) to maximize attendance and booking retention.
- Frictionless rescheduling: One-click reschedule and cancel options that allow customers to free up slots in advance, enabling redistribution to waiting clients.
- Recovery revenue tracking: Clear visibility into recovered appointment slots and their direct financial impact on practice revenue and staff utilization.
Dynamic Staffing & Demand Forecasting
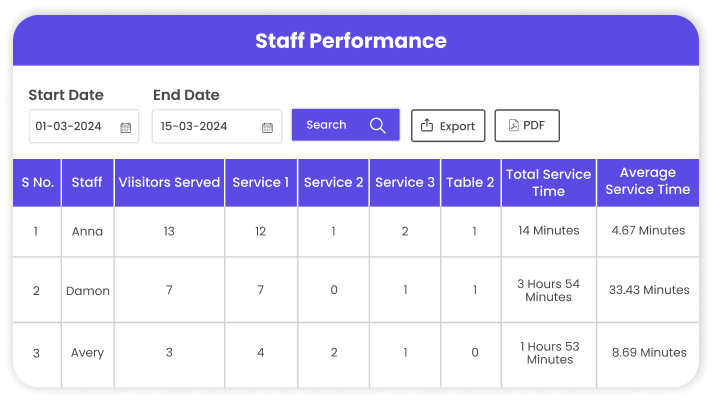
Switch fixed shift templates to smart scheduling that adjusts based on actual customer demand. Use historical queue data to understand how customer traffic changes on different days, times, and seasons. This approach allows you to staff more effectively and allocate resources according to real customer needs.
Key capabilities include:
- Predictive demand modeling: Leverage historical transaction data to forecast volume patterns and optimize staff deployment for each unique day type and season.
- Precision shift alignment: Schedule breaks, overlaps, and coverage windows to match identified peak periods, eliminating both understaffing bottlenecks and idle time waste.
- Queue metrics performance tracking: Monitor transactions per labor hour, wait time reduction, and overtime costs to quantify operational efficiency gains and cost savings.
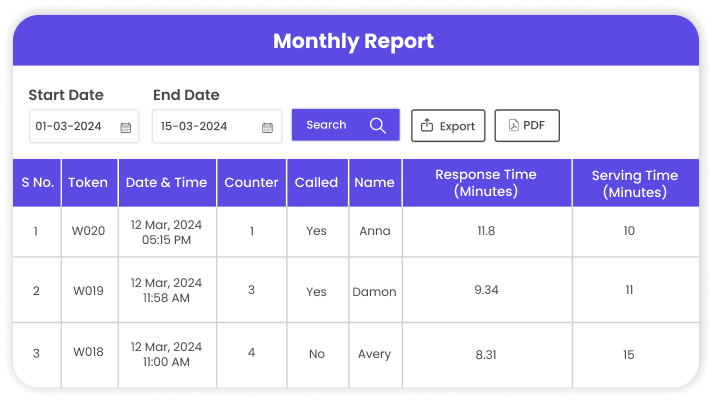
Walkout Tracking & Behavioral Analytics
Use mobile check-in systems or lobby kiosks that capture every customer arrival, regardless of service completion, providing complete visibility into abandonment patterns. Detailed analytics reveal walkout rates segmented by time, day, and reason codes, allowing for targeted operational interventions that directly address root causes.
Key capabilities include:
- Complete arrival tracking: Log every customer who enters your facility, creating a full funnel view from check-in through service completion or abandonment.
![]()
- Pattern identification: Analyze walkout trends by hour, day, service type, and wait duration to pinpoint specific operational gaps driving customer loss.
- Intervention ROI measurement: Test operational changes (extended hours, additional staff, process improvements) and quantify revenue recovery against implementation costs
Queue analytics as a management discipline
Monthly review meetings where the operations lead, front-line supervisors, and scheduling coordinator review: average wait time by service type, peak demand windows, no-show trends, walkout rates, and throughput per FTE.
Key capabilities include:
- Structured performance review: Monthly data-driven meetings that surface operational friction points and track progress against improvement initiatives.
- Cross-functional collaboration: Unite operations, scheduling, and front-line teams around shared metrics, ensuring insights translate into coordinated action.
- Continuous optimization framework: Systematically identify, prioritize, and address bottlenecks through iterative improvement cycles backed by quantifiable results.
If you also want to calculate your queue management KPI’s daily, but don’t know from where to start? Must read our blog: Queue Management KPIs: 5 Metrics That Drive Operational Excellence.
The ROI Math You Need to Know
Understanding the financial impact of queue management isn’t theoretical! It’s a straightforward calculation that reveals exactly how much poor wait experiences are costing your operation right now. Let’s understand this with an example:
Baseline scenario:
- Mid-sized retail bank branch
- 280 daily walk-in customers
- Average transaction value: $85
- 12 daily walkouts (4.3% walkout rate)
- 18-minute average wait time
- 6 teller stations, average 14 transactions/hour per teller
- 22% no-show rate on appointments (60 weekly appointments)
Annual queue management cost:
- Walkouts:12/day × 250 operating days × $85 = $255,000
- No-shows: 22% × 60 appointments = 13.2 no-shows/week
- Annual cost = 13.2 × $180 × 50 weeks = $118,800
- Throughput drag (lost transactions): 6 tellers × 4 lost tx/hr × 8 hours/day × 250 days × $85 = $4,080,000
- Overtime / overstaffing: 15 hours/week × 50 weeks × $22/hr = $16,500
- Total annual leak (baseline) = 255,000 + 118,800 + 4,080,000 + 16,500 = $4,470,300
Improved scenario with Bank queue management system:
- Walkout rate drops to 1.8% (reduced by 58%)
- No-show rate drops to 12% (a reduction by 45%)
- Throughput improves to 16.5 transactions/hour per teller (18% gain)
- Staffing optimized, eliminating 10 hours/week of excess labor
Annual recovery:
- Walkouts: 58% × $255,000 = $147,900
- No-shows: 45% × $118,800 = $53,460
- Throughput: 18% × $4,080,000 = $734,400
- Labor: Save $1 10 hours/week × 50 weeks × $22/hr = $11,000
- Total annual gain: 147,900 + 53,460 + 734,400 + 11,000 = $946,760
Investment required:
- Queue management platform: $4,800/year
- SMS appointment reminders: $1,680/year
- Implementation consulting: $8,000 one-time
- First-year cost: $14,480
- Net first-year benefit = Total annual gain − First-year cost = 946,760 − 14,480 = $932,280
- Net first-year ROI (net benefit ÷ cost) = 932,280 / 14,480 ≈ 64.383 → 6,438% (approx)
This is not hypothetical. We’ve seen these numbers in branches, clinics, and service centers that are committed to fixing the queue.
Quick Wins You Can Implement This Quarter
You don’t need to overhaul your entire operation to start reclaiming revenue. Here are four moves that pay back within 90 days:
Turn on appointment reminders
If you offer scheduled appointments, whether medical, financial, or government services, set up automated reminders right now. Most scheduling platforms already include SMS integration. If yours doesn’t, tools like Twilio or Remind can fill the gap for $50–$150 per month. Start with the appointment types that see the most no-shows (typically late-day slots and first-time clients). You can expect no-shows to drop by 30–50% within two months.
Install a simple queue counter

You need to know how many people walk through your doors versus how many you actually serve. A simple lobby kiosk for check-in, or even a manual tally sheet at the entrance for two weeks, will show you the gap. One government office tracked this for 10 business days and found they were losing 18% of visitors before they ever received service. That single data point was enough to justify the budget for a mobile queue app.
Map your demand curve
Pull three months of transaction timestamps from your POS, EMR, or CRM system. Plot the volume by hour and day of week to identify your top three peak windows and your deepest low points. Then shift breaks and lunches to those quieter periods, and add overlapping coverage during peak times.
Measure wait time manually for two weeks
Have a manager or supervisor time 20 random customer journeys each day, from arrival to when service actually begins. Calculate the average and look at the distribution. If your average wait exceeds 10 minutes, or if 75% of customers are waiting over 15 minutes, you’re facing a significant queue management problem. Use that data as your baseline to track improvements over time.
Common Mistakes That Undermine Queue Systems
Organizations that try to fix queues and fail usually make one of these mistakes:
Buying a queue system without changing the workflow
Software can’t fix a broken process. If you’ve got eight handoffs and three systems, streamline the workflow first. Otherwise, you’re just getting a clearer view of something that still doesn’t work.
Optimizing for average wait time instead of peak wait time
Customers don’t care about your 8-minute average wait time when they just waited 24 minutes. Focus on your longest waits! That’s where people walk out.
Implementing queue management without front-line buy-in
Staff won’t use systems that feel like surveillance. Involve them from the start. Show how it helps them. Explain the benefits, like less chaos, fewer complaints, and clearer priorities. And reward the improvements, don’t just track them.
Not tracking the counterfactual
You can’t prove a queuing system worked if you don’t know where you started. Measure your current walkouts, no-shows, and wait times first. Without it, you can’t prove the system worked when budget season rolls around.
Recover Lost Revenue Through Smarter Queue Management
If you’re reading this as a manager or director trying to get budget for queue management improvements, here’s the pitch that works:
Open with the stats: “We’re losing $X annually in walkouts and no-shows. Here’s the data from our two-week manual tracking.”
Frame it as margin expansion, not cost: “This isn’t a new expense: it’s recovering revenue we’re already earning but not capturing.”
Show the payback period: “At $15K investment and $180K annual recovery, we’re profitable in 30 days.”
Use competitive pressure: “Our closest competitor just cut their average wait time in half. We’re going to lose our share if we don’t match.”
Tie it to strategic goals: If your organization has patient satisfaction targets, NPS goals, or efficiency mandates from the board, map queue improvements directly to those.
Offer a pilot: “Let’s run this at our highest-volume location for 90 days. If we don’t see a 20% improvement in wait times or a 15% reduction in walkouts, we don’t expand.”
Budget owners approve projects that have clear ROI, measurable outcomes, and low risk. Queue management improvements check all three boxes.
The New Urgency in Queue Management: What Leaders Must Know
Three forces are making queue management software cost more visible and more urgent this year:
Post-pandemic expectations have permanently shifted
Customers got used to scheduling, mobile check-in, and status updates during COVID. They’re not going back. If you still make people show up and wait blindly, you’re already behind.
Labor costs are 18–30% higher than they were three years ago
You can’t fix inefficiency by hiring more people. Every wasted hour costs you $25–$40 in labor. Optimization isn’t optional anymore! It’s how you stay profitable.
Digital competitors are eating the simple transactions
Digital Queues Are Changing the Way Businesses Serve Customers. As simple transactions move online, your in-person customers become more complicated. They need more help and take longer. If your queue can’t sort by complexity, your wait times will increase, and throughput will collapse.
Companies that fix their queue management will win. The ones that don’t will keep losing customers to anyone who values their time.
Next Steps: Calculate Your Specific Number
Every operation is different. Your queue management cost depends on your transaction mix, labor costs, volume, and current wait times.
Qwaiting has a free calculator that lets you plug in your numbers and see your specific revenue leak and recovery potential.
Calculate Your Wait Time Revenue Loss →
Book a 20-minute diagnostic call here. We’ll review your operation, identify your top two levers, and show you what good looks like in your industry.
Final Thought
Queue management cost is the most fixable revenue leak in service operations. Unlike market conditions, competitive pricing, or customer acquisition costs, you control this completely. The money is currently in your operation, found in the customers who walked out yesterday, the appointments that no-showed this morning, and the opportunities you’re missing every single shift.
The organizations that succeed in 2025 will be those that no longer accept long wait times as a normal part of operations. Instead, they will treat queue performance as a key operational metric, placing it alongside other important measures such as revenue per employee, cost per transaction, and customer satisfaction.
Your queue is either making you money or costing you money. There’s no neutral.
Which side are you on?