
Every minute a customer waits in line costs more than just time it costs trust, loyalty, and revenue. According to Forbes, 70% of customers are less likely to return after experiencing long wait times. For operations leaders, this isn’t just a customer service issue, it’s a daily challenge that impacts revenue, efficiency, and long-term loyalty.
That’s where Qwaiting makes the difference. Our platform gives operations leaders real-time visibility into what’s happening in their queues from walkaways to bottlenecks to hidden delays. Instead of waiting for next week’s reports, leaders can act in the moment to optimize performance and improve the customer experience.
In this article, we’ll define the top five queue metrics every operations manager should track daily. These insights will help you measure success, identify inefficiencies, and make smarter operational decisions that drive growth.
Why Waiting for Weekly Reports is Costing Your Business
Ignoring queue management KPIs costs revenue, frustrates customers, and weakens operations. Daily tracking turns hidden leaks into visible insights, giving leaders control, speed, and a real competitive edge.
Here’s why businesses should measure metrics regularly:
Long Lines = Lost Loyalty
If one customer walks away every hour because of long lines, small losses add up to huge missed revenue each day. Delays frustrate customers. Studies show that 82% of consumers avoid stores because of visible long lines.
Ignoring daily queue issues leads to staff overload, misaligned staffing, and chaos.
Why Real-Time Dashboards Are Not Enough
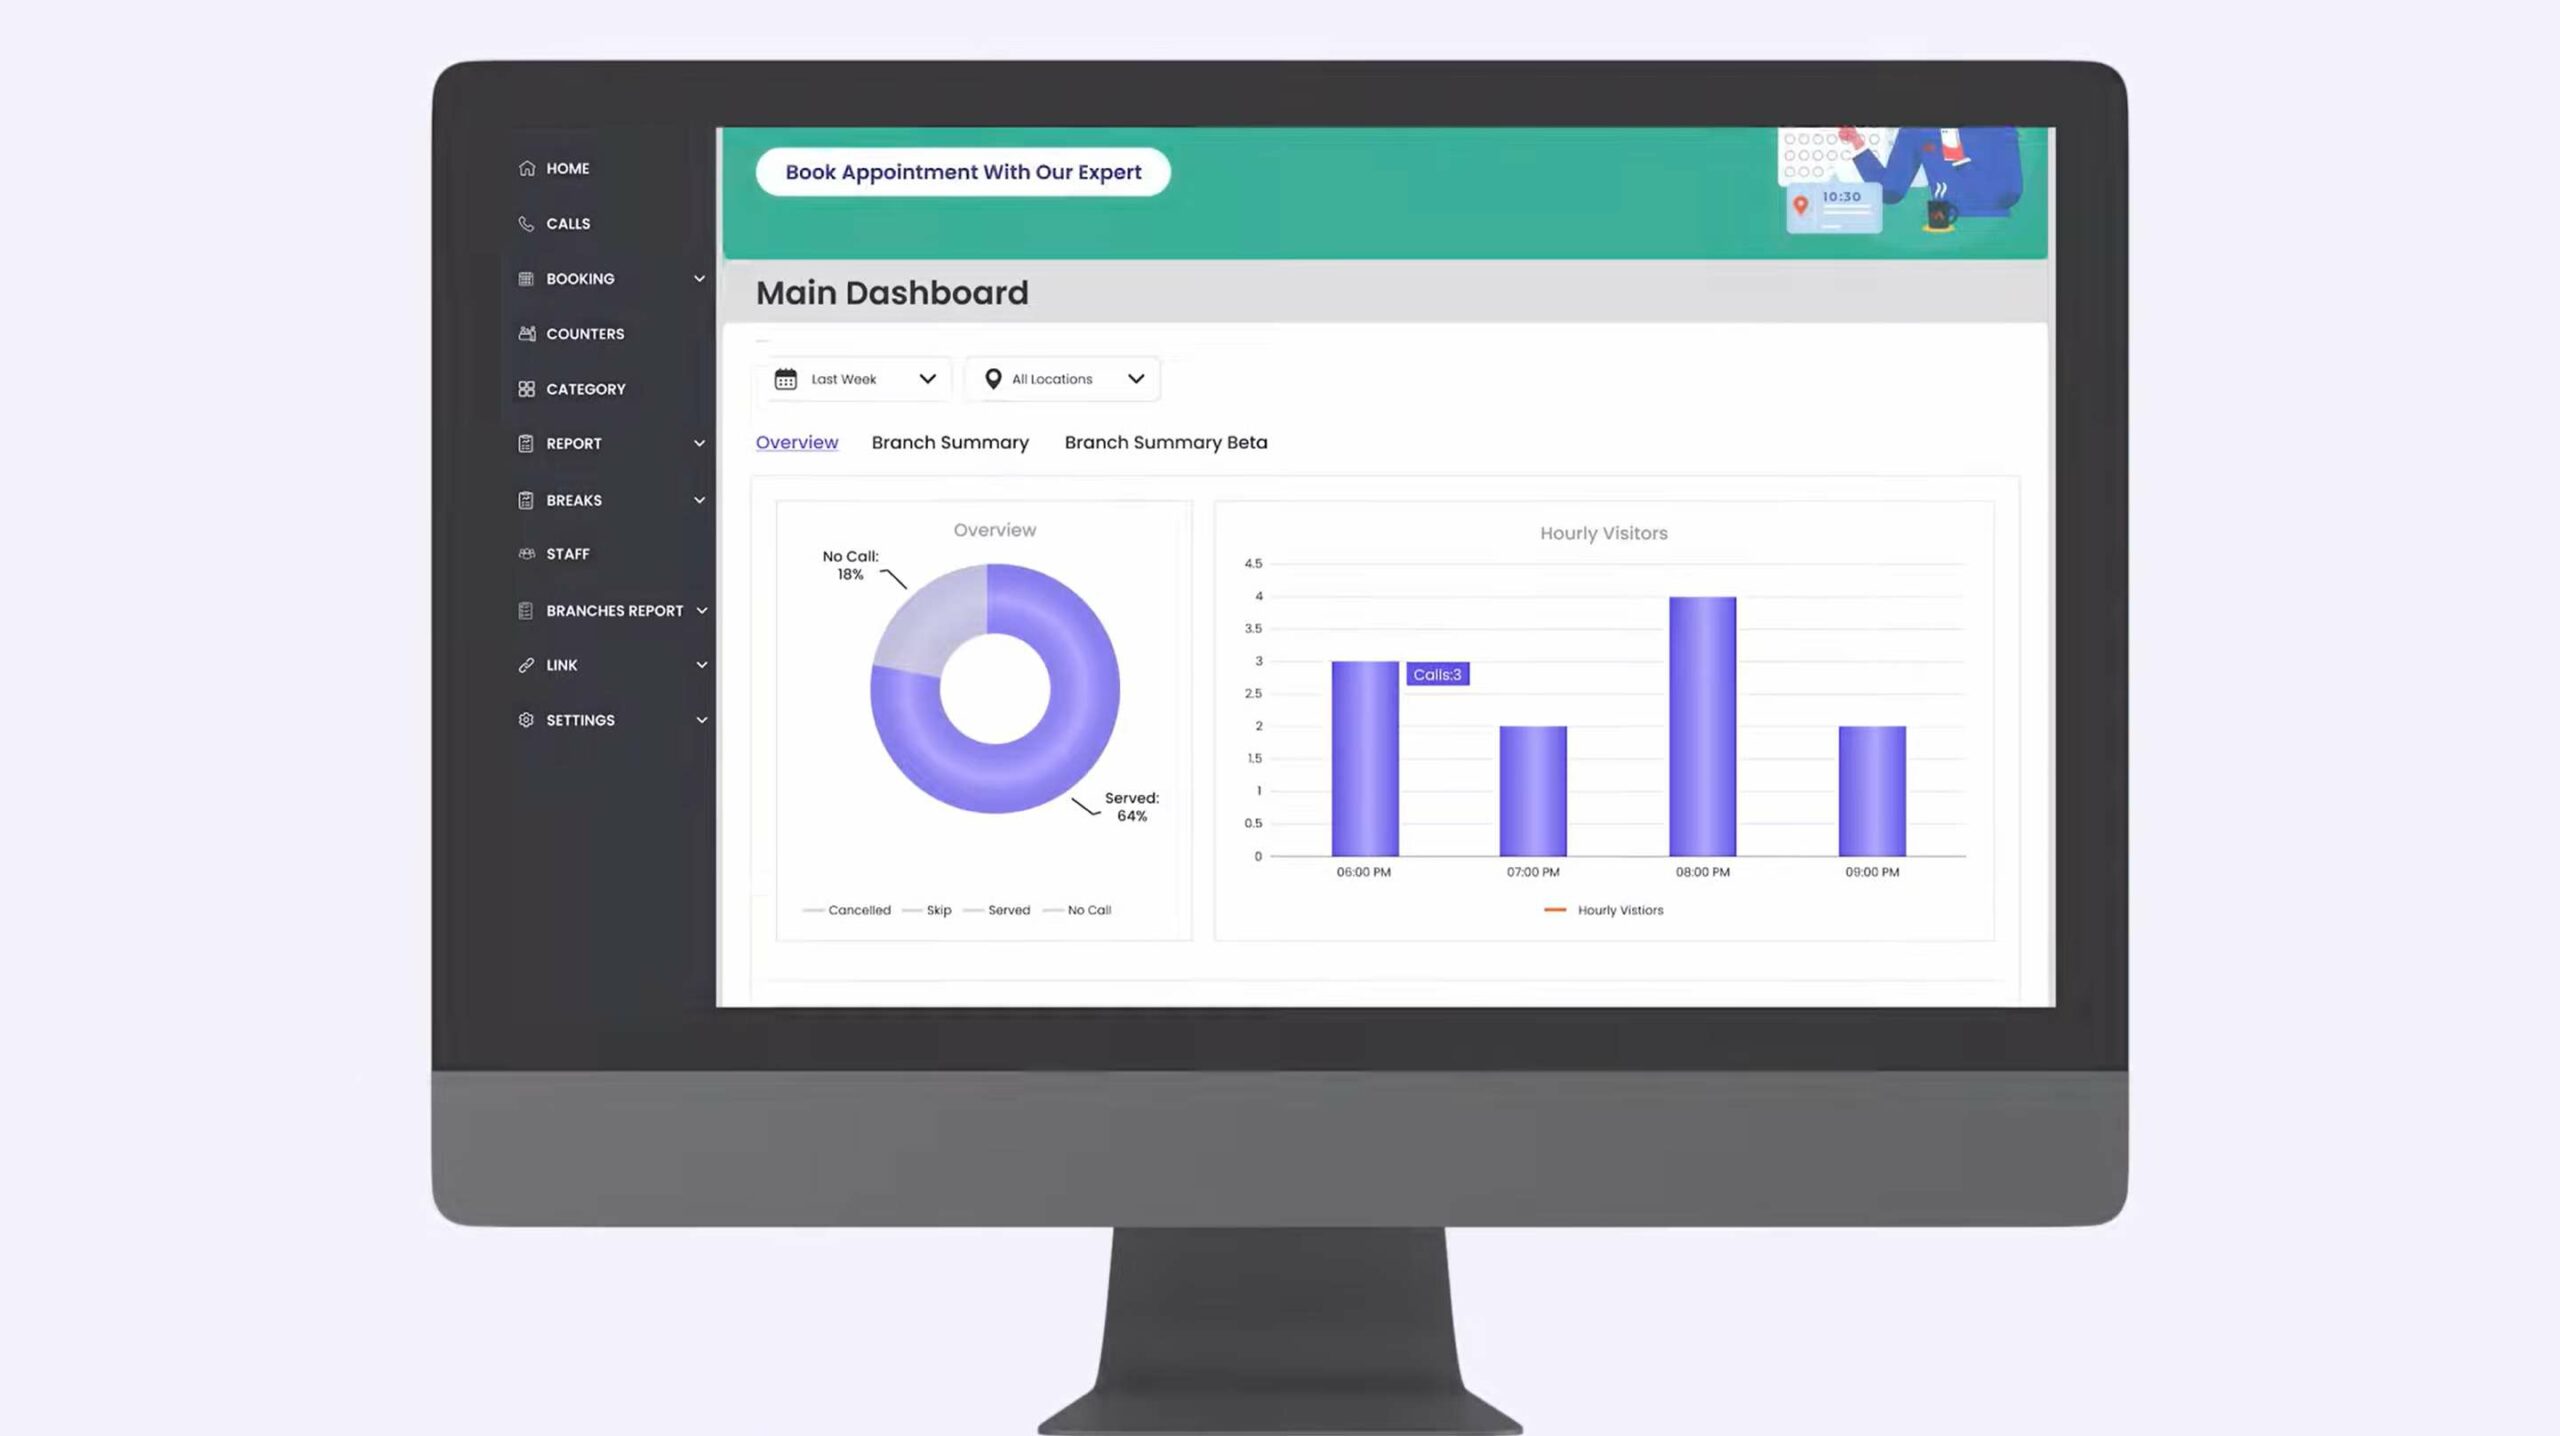
Real-time dashboards are great, but without daily review, leadership misses patterns. A spike on one day might look fine in real time, but it becomes alarming when seen over several days.
Without accountability, small issues are tolerated until they become crises.
Faster Decisions Start With Daily Queue Tracking
When leaders track KPIs daily, they can adjust staff rosters, shift resources, open extra counters, etc. Frontline feedback becomes visible (via data) to decision makers in time to act.
Competitive Edge Through Daily Vigilance
Companies that outperform the competition often track queue metrics every single day. They catch early warnings: rising abandonment, increasing wait times, dips in customer feedback.
Metrics That Show You What’s Really Happening in Your Queues
Here are the five metrics every operations head should check daily. Qwaiting makes capturing these easy, accurate, and reliable.
1. Queue Length—The Pulse of Customer Patience
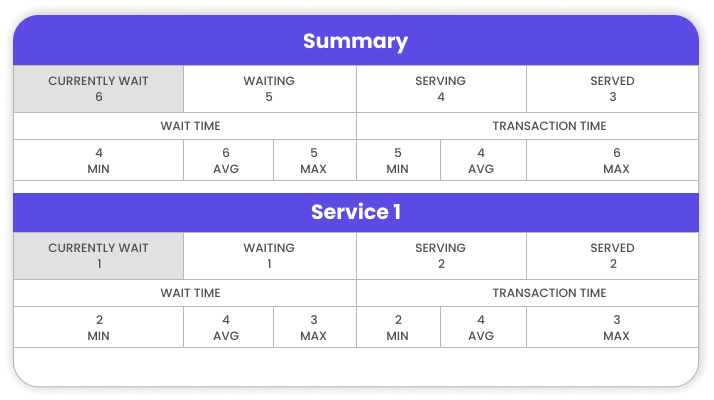
- Customer frustration increases with queue length, typically when exceeding 5-10 people. Even visible lines alone can cause dissatisfaction.
- Each extra minute in the queue can lower the chances of purchase or service completion.
From Reactive to Proactive Flow Management—How Daily Review Prevents Chronic Bottlenecks
- Early detection of queue build-ups allows proactive staffing adjustments, counter openings, or process modifications.
- Qwaiting gives you the queue management tools to see which service point is lagging and act immediately.
2. Average Wait Time – The Daily CX Scorecard
- Customers expect fast service. Wait time is often the metric that they remember most. For example, if the average wait time for support calls is over 2 minutes, satisfaction drops sharply.
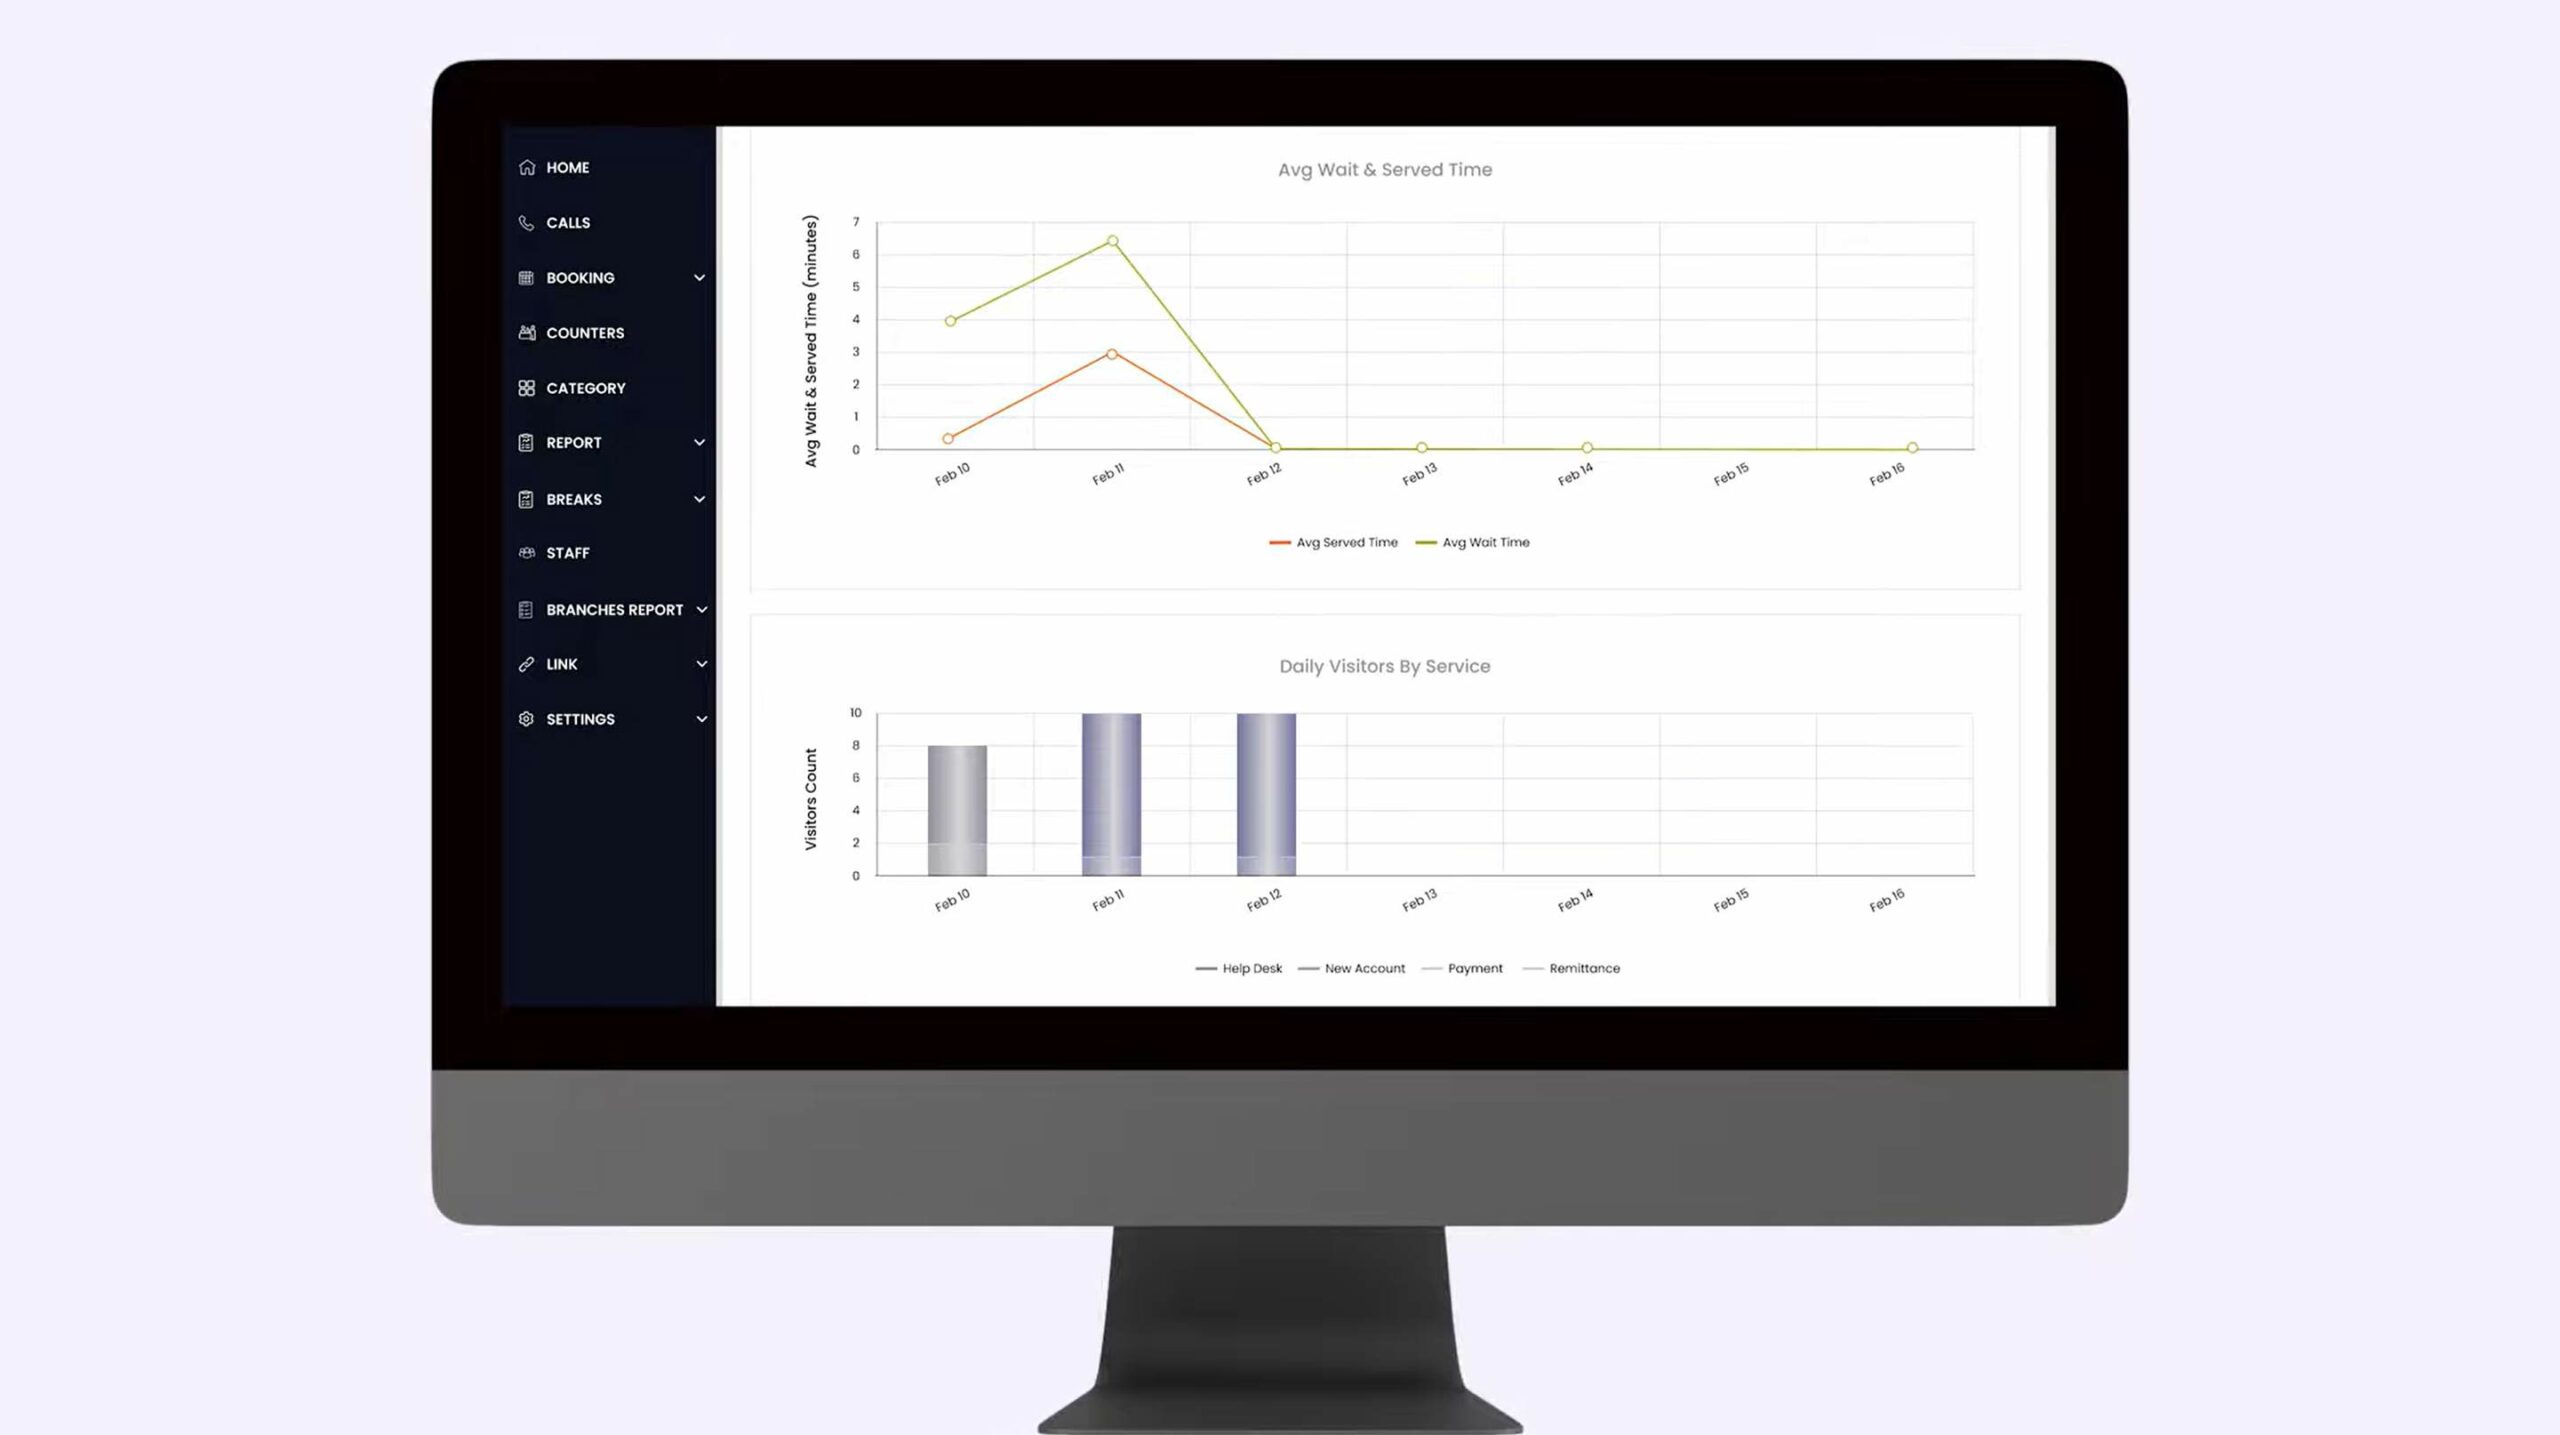
- Even though monthly averages don’t show the changes from day to day, looking at daily data helps businesses see when wait times get longer (like during lunch or shift changes). This affects customer loyalty and helps us make better staffing choices.
Measuring the Impact on Staff Productivity—wasted minutes = reduced throughput
- When staff are idle or overwhelmed because waits are long, efficiency drops.
- Capturing each step (arrival, service start, service end) helps assess how productive each team is.
The Benchmark Every Operations Head Should Enforce Daily—Setting Red-Line Thresholds
- Define what’s acceptable: e.g., 80% of customers served within 3 minutes.
- Alert when the average wait time goes over the set limit. Qwaiting’s queue management solutions help you set these limits and keep track of them.
3. Customer Throughput & Abandonment Rates
- Many customers leave before service once the queue looks long or the wait promises are vague.
- In a survey, more than 68% of consumers admit to leaving a line before being served.
Daily Tracking vs. End-of-Quarter Shock—Why Annual Churn Audits Come Too Late
- Seeing abandonment at the end of the quarter means revenue is already lost.
- Daily metric tracking reveals trends, such as rising walk-aways, allowing intervention.
Tools That Help Leaders Spot Walk-Aways Instantly—Integrating Alerts into Dashboards
- Qwaiting provides real-time alerts on abandonment, trends, and drop-offs.
- Corrective measures include staff reallocation, customer messaging, and queue redesign.
4. Service Time & Staff Performance – The Efficiency Metric
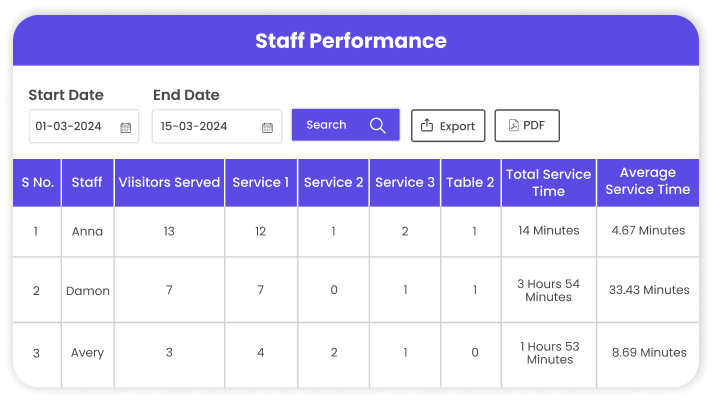
- Observe how long the staff takes once the service begins. When staff sees their own performance daily, they can self-correct.
- Provide guidance and support to underperforming employees to help them improve their work in the future. Consistent, small adjustments lead to significant progress over time.
5. Daily Customer Feedback – The Unfiltered Truth Behind Your Queues
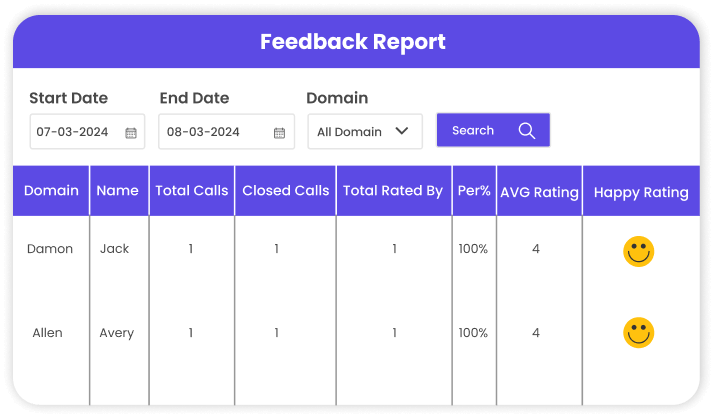
- Customer sentiment is the hardest but most crucial metric because it reveals the ‘why’ behind the numbers, exposing frustrations and delights.
- If many customers complain about wait time or staff behavior over a few days, it’s a red flag.
Linking Queue Metrics With CX Scores (CSAT, NPS, VOC) – the daily reality check for leaders
- Update CSAT/NPS daily if possible, correlating with queue length, wait time, and abandonment rate.
- Each small improvement (e.g., better signage, faster greeting, clear wait times) builds trust.
Explore Our Other Resources:
Virtual Queues vs. Token Systems: Which Is Right for Your Business?
The Future of Customer Journeys: Digital Signage That Guides, Engages, and Converts
Conclusion
Queues are more than just lines; they are the vital pulse of your daily operations. Ignore them for even a day, and you risk losing customers, revenue, and staff efficiency. By tracking queue length, average wait time, abandonment rate, service performance, and customer feedback, operations leaders gain the real-time clarity needed to make fast, informed decisions.
Qwaiting changes the way you manage your operations. Our platform collects data and turns it into insights you can use right away. You will receive alerts that identify problems and see dashboards that show real-time and daily trends. Qwaiting helps you stay in control.
The leaders who succeed tomorrow are the ones who monitor and act today. Are you ready to make every queue count with Qwaiting? Book your consultation call with our experts and start your 14-day free trial today.